Dashboards are a way for you to organize your data within Syncrofy based on your business needs. They are a great way to view the overall health of your business and see a real-time overview of your entire operation. You can discover how critical information impacts your bottom line and view past performance, patterns, and future opportunities.
You can build your dashboard by adding widgets that contain charts comprised of specific datasets, filters, and configurations. You can also build multiple dashboards within a single environment to highlight specific datasets (e.g. only Purchase Orders or Invoices) or specific types of widgets (e.g. only line charts or pie charts). Then, share them with your partners to collaborate, compare information, and resolve issues.
¶ Using a Dashboard Template
- Click the Import Template icon in the upper right-hand corner.
- Select the dashboard template you wish to use by clicking the Import icon in the lower right-hand corner of the template.
- The selected dashboard will now appear on the main Dashboards screen.
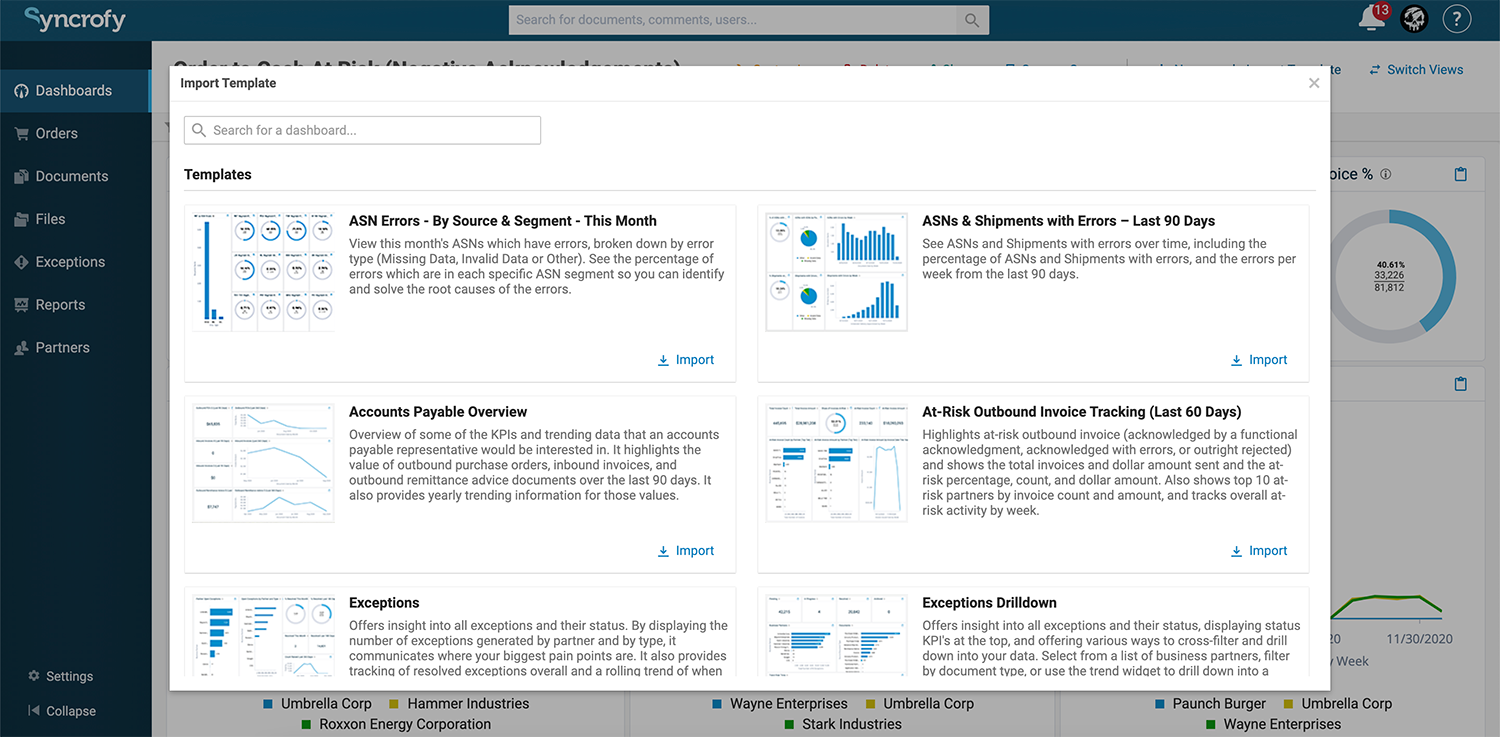
Note: You can also search for a specific template by typing your search term(s) in the text box in the upper left-hand corner of the Import Template screen.
¶ Creating a New Dashboard
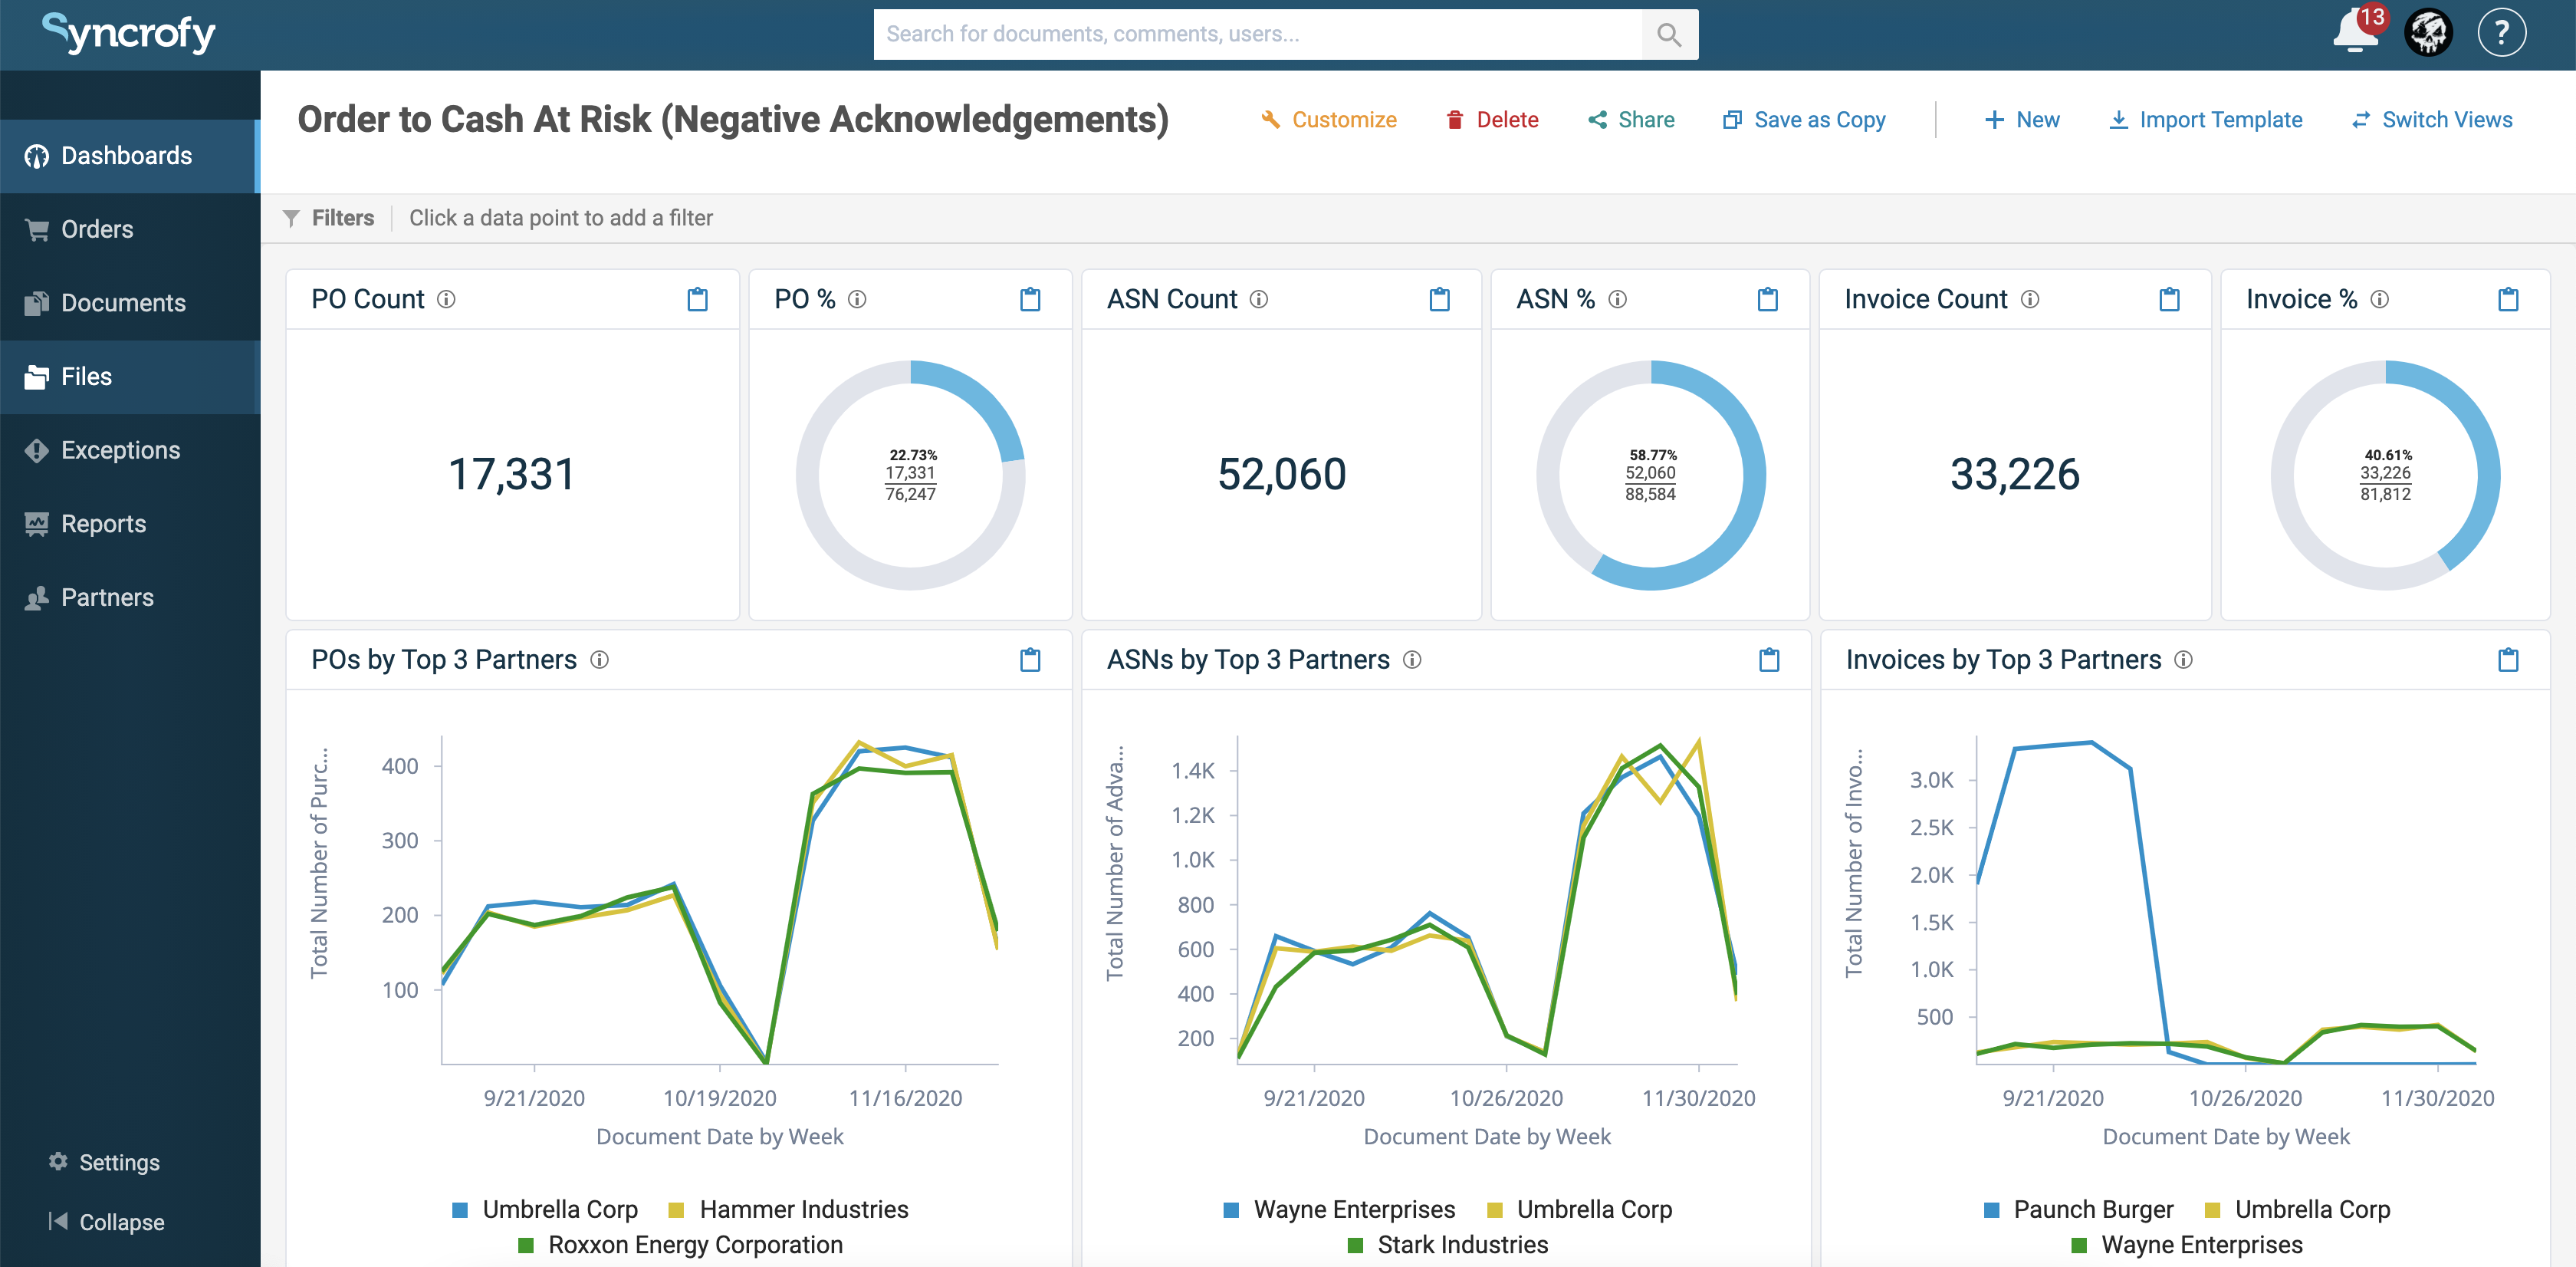
- Click the New icon (highlighted above) in the upper right-hand corner of the main Dashboards screen.
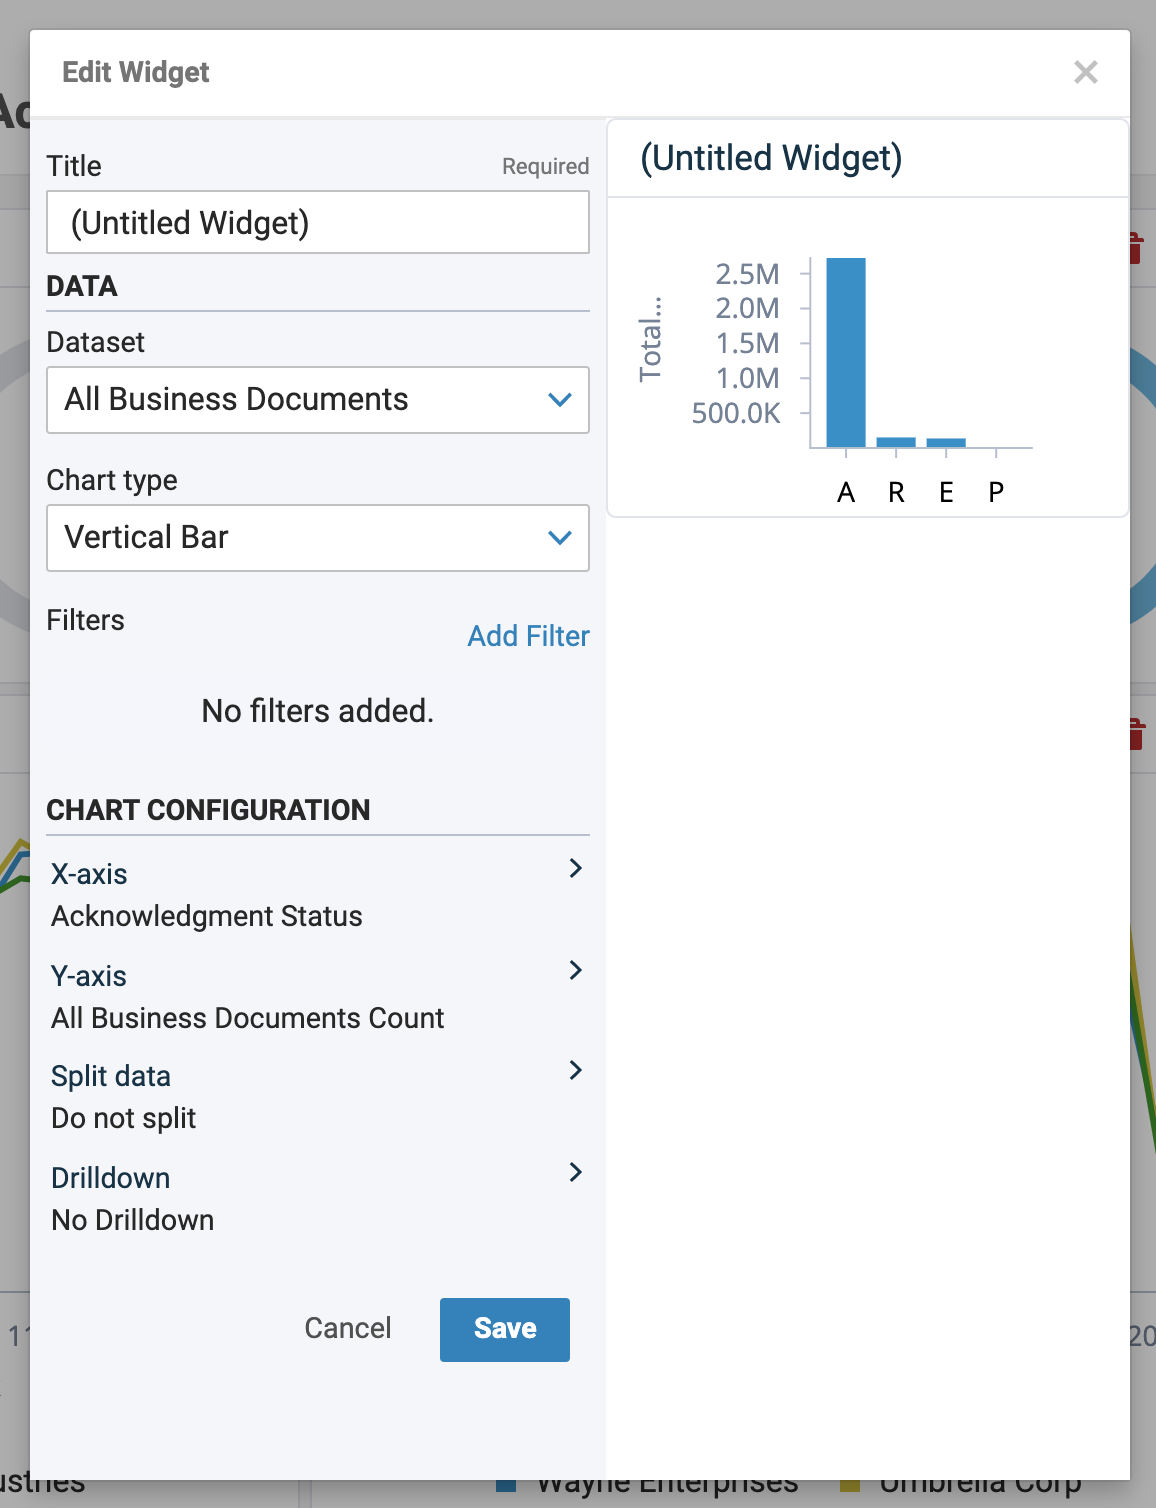
- Then, the Edit Widget screen will appear.
- In the "Title" text box, enter the name you wish to give the dashboard (required).
- Click the "Dataset" dropdown menu to choose the specific dataset you would like to use (e.g. Invoice, Purchase Order, Advance Ship Notice, etc.).
- Click Add Filter to apply a specific filter to the dataset (e.g. Acknowledgment Status, Document Date, Invoice Amount, etc.). They can be values that pertain to the selected document (i.e. Flow Direction, Document Name, Business Partner, etc.) or criteria that pertain to the business process the document is a part of (i.e. "Purchase Orders that have an associated Invoice, "Invoices that do not have an associated Remittance Advice," Purchase Orders that have not been shipped"). For a complete list of business process criteria, click here.
- The "Chart Configuration" section will enable you to choose the field of the dataset to be displayed in the chart. This section is specific to the type of chart you choose.
- For example, let's say you select the "Invoice" dataset and a line chart. The "Chart Configuration" will display options for the X-axis, Y-axis, and whether you would like to split the data into multiple lines. Select X-axis to choose the specific "Field" within the "Invoice" dataset you wish to display. In this case, your options will be "Document Date," "Invoice Date," "Last Commented On," and "Loaded On Date." Then, select Y-axis and do the same.
- Click the Save button to save and create your dashboard.
- Your dashboard will now appear on the main Dashboards screen.
Note: When you choose to "Split Data" in Line charts, you can select whether you want to "Split on field" or "Split on time interval." For the latter, you can choose to see a year-over-year view by selecting "Year" in the "Time Interval" dropdown box.
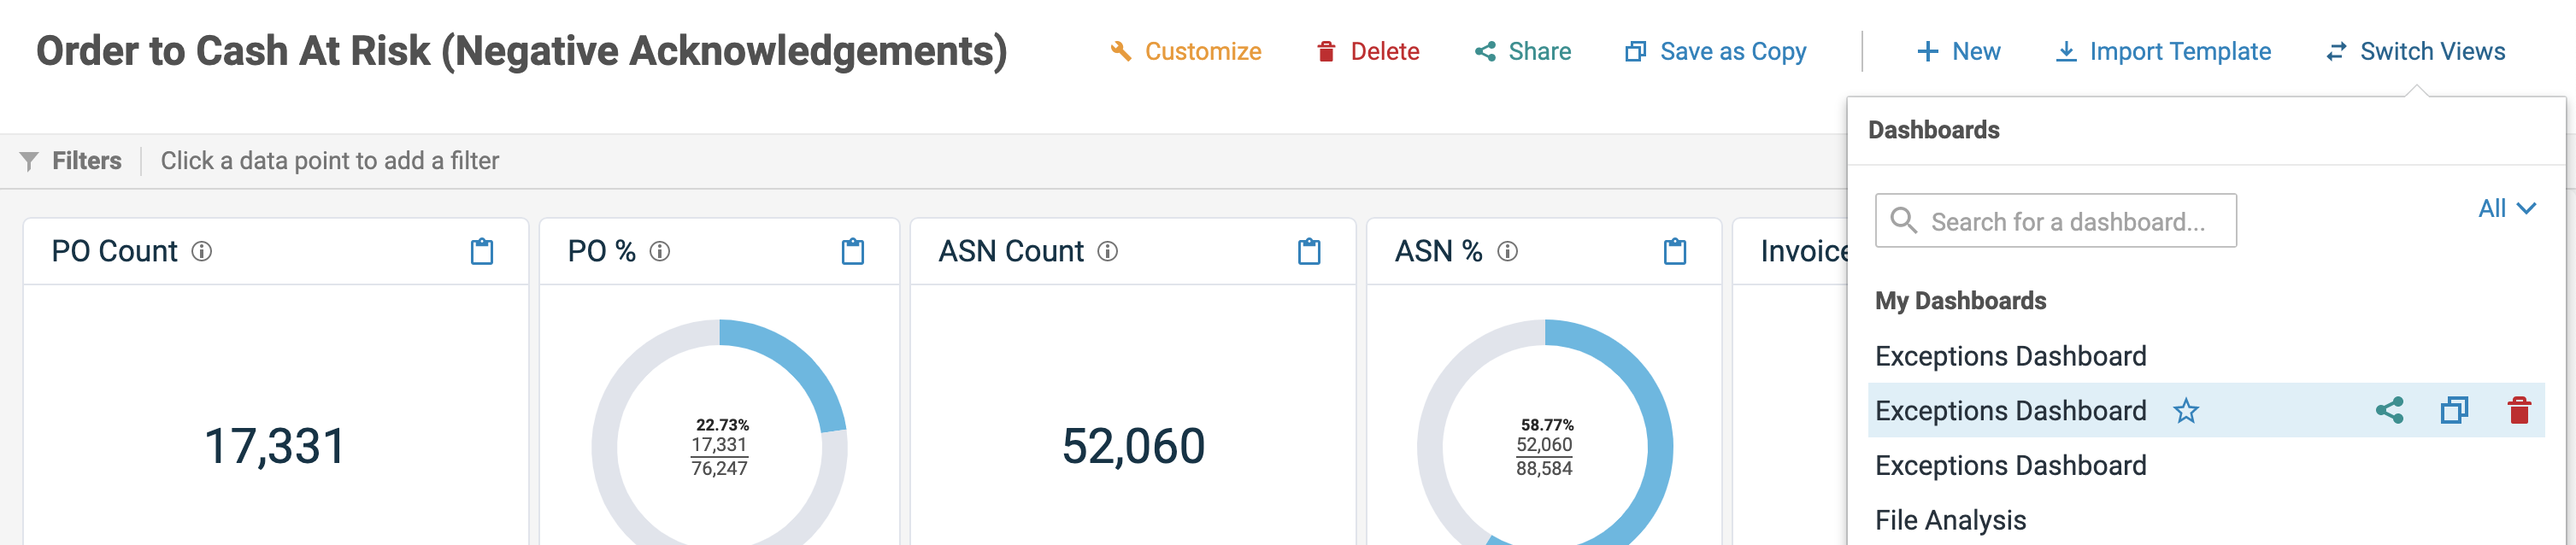
Note: If you have created more than one dashboard, you can select which one is displayed on the main Dashboards screen by clicking the Switch Dashboard icon (highlighted below) in the upper right-hand corner and then selecting the desired dashboard. The name of the current dashboard being viewed is displayed below "Dashboards" in the upper left-hand corner.
¶ Adding a Widget to a Dashboard
Syncrofy gives you the ability to add multiple widgets to a single dashboard, allowing you customize the data you see and how you see it. For example, you may want display all your purchase order data on one dashboard and invoice data on another. In that case, you will need multiple widgets (charts) within each dashboard.
To add a new widget to your dashboard:
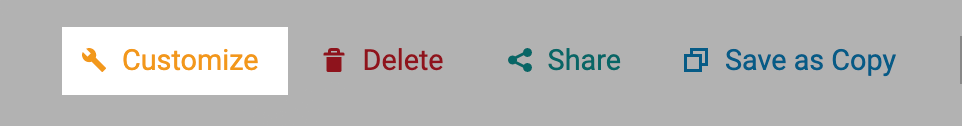
- On the main Dashboards screen, click the Customize button in the upper right-hand corner.
- Click the Add Widget button.
- Follow the instructions on screen and select the area of the dashboard where your new widget will be located.
- Follow Steps 2-7 in "Creating a New Dashboard."
¶ Managing Widgets
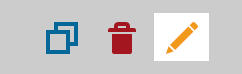
You can customize your widgets by clicking any one of the three buttons in the upper right-hand corner of the widget.
Duplicate Widget: Creates a copy of that widget and allows you to choose where to place it on your dashboard.
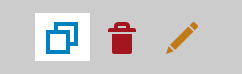
Delete Widget: Removes the widget from your dashboard.
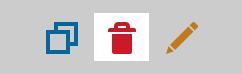
Edit Widget: Enables you to modify specific information regarding the widget (Title, Dataset, Chart type, etc.)